
Financial well-being
An exploratory study of how first-time earners budget, save, and carry financial stress
2024 · 11 weeks · 5 phases
- My role
- Study design and protocol, moderated observations and interviews, inductive and in-vivo coding, affinity mapping, persona spectrums and personas, scenarios and journey maps, feature prioritization, and the design implications.
- Team
- Four UX researchers, contributing equally across both studies. DePaul University, HCI 445.
- Full work
- Read the full research report (opens in a new tab)
First-time earners do not lack budgeting tools. They lack a reason to open them.
01 Context
A well-served problem, and the part of it nobody was serving
Somewhere between the last semester and the first paycheque, a person picks up rent, tuition, a student loan, and a set of decisions nobody taught them to make. The transition is abrupt and it is badly supported. The money stress that follows does not stay inside the money. It shows up in coursework, in sleep, and in how people talk about their own competence.
The category is not short of software. Mint, YNAB, and PocketGuard all address this user, and all of them are built on the same premise, which is that the hard part is knowing where the money went. Reading through the prior work on financial technology and young adults, the recurring complaints were about something else. They were about cost, about complexity, about a learning curve steep enough that setup itself became the point people quit, and about having no answer to why anyone would keep going after week three.
So the problem was not a missing feature. Motivation, adaptability, and emotional load are the three things that decide whether a budgeting system survives a real month, and all three sat outside what these tools were built to handle.
That decided the kind of study to run. Evaluating an existing product would have told us how well one tool performs against its own assumptions. We wanted to test the assumptions, which meant exploratory research with no product in the room:
How can a technology-based solution help first-time job holders and students better plan their budgets, motivate them to save, and track their expenses to lead a stress-free life?
02 Method
Two methods, because what people do and why they do it were never going to come from the same session
| Phase | Method | n |
|---|---|---|
| 01 | Scenario-based contextual observations, participant’s own tools | 9 |
| 02 | Semi-structured interviews, motivation and emotion | 8 |
| 03 | Inductive and in-vivo coding of transcripts in Atlas.ti | 17 |
| 04 | Affinity mapping and hierarchical group mapping, whole team | 17 |
| 05 | Persona spectrums across 11 behavioural dimensions | 8 |
| 06 | Feature prioritization against impact and feasibility | 10 |
Seventeen participants between 23 and 32, recruited by snowball sampling through the team’s own networks: graduate students, students holding part-time campus jobs, and full-time professionals early in their careers. Sessions ran in person where we could and over Zoom or Google Meet where we could not, recorded with consent in both studies.
The observation was built around a proxy. Instead of asking participants to walk through their own finances, we asked them to help Kevin, a hypothetical international student, plan a monthly budget using whatever tools they normally use. That substitution did two jobs. Explaining a system to someone else makes people say out loud the rules they follow silently, which is where the real strategy lives. It also takes the sting out of the subject. Someone will hand Kevin a piece of advice about spending that they would be much slower to volunteer about themselves.
What it bought us was watching. We could see how funds were allocated across fixed, variable, and discretionary categories, in what order, and what happened to the whole structure when we dropped an unexpected expense into the middle of it.
The interviews went after what observation cannot reach. Why a person started tracking, why they stopped, what they felt when the balance dropped, and what they made of the tools they had tried and given up on.
Analysis was done alone and then reconciled. Each of us coded our own transcripts descriptively and in vivo in Atlas.ti. The team then rebuilt the codes as an affinity diagram in FigJam, grouped them upward into a hierarchical map, and compressed the observation data into a sequence diagram of the path most participants took. Four themes came out of that, and they are the spine of everything below.
03 Evidence
What seventeen people said and did about their own money
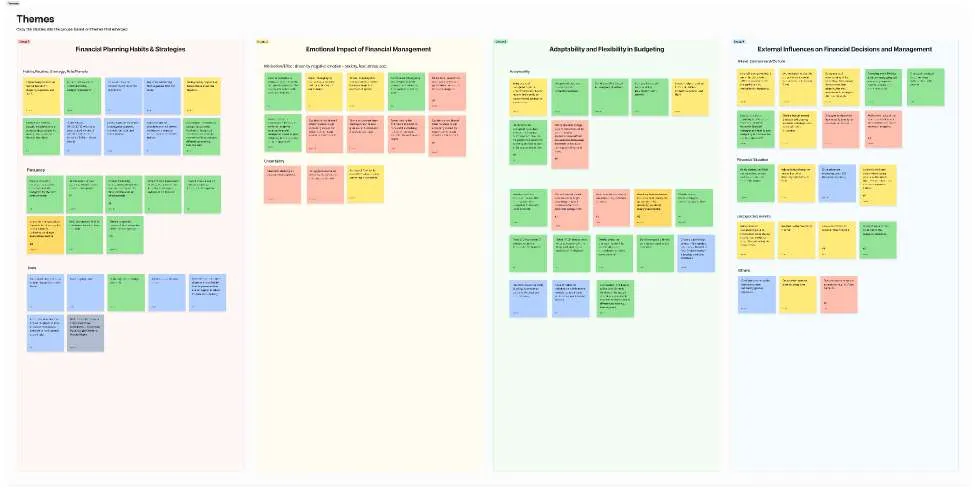
Everyone had a system. Not a good one in every case, but a system. Weekly or monthly review, fixed costs taken out first, whatever survived treated as fluid. The tooling ran from Google Sheets to a bank app to paper. What predicted how much effort a person spent was not how sophisticated their tool was. It was how much of the work the tool refused to do for them.
I write everything down in a notebook. It’s more work, but it keeps me focused on my spending.
Steven, observation session
Emotion was the engine, and it ran both ways. Fear, stress, and anxiety were what started most participants budgeting in the first place. Four of the nine observation participants described stress at a specific moment: when the balance dropped below a number they were holding in their head. Not at the end of a bad month. At the drop.
4 of 9 observed → stress at the drop itself
Where the emotional cost landed: on the moment the balance moved, not on the monthly total
Whenever I see my balance drop below a certain number, it’s stressful. It’s always on my mind.
Caleb, observation session
The same thing ran in the other direction for participants who felt on top of their money. Cassie described knowing where her money goes as control over her life rather than control over her account. That is what makes visibility worth building properly instead of treating it as a reporting nicety.
Adaptability split the sample cleanly. Three observation participants protected the essentials and rebalanced everything else when something unexpected landed. Others had set aside a category for exactly this in advance. David kept a fixed monthly buffer he treated as untouchable, and he was clear that the amount mattered less than the fact of it.
$250 a month → never touched
David's emergency allocation. Small against his income, and the reason an unexpected expense stayed an inconvenience instead of becoming a crisis
Participants without a buffer had nothing to fall back on. They paid for the surprise out of whatever category was softest, after the fact, by hand.
When something unexpected happens, I have to pull from other areas like dining out or entertainment. It’s frustrating, but there’s no other way to manage it.
John G., interview
Outside conditions did most of the destabilising. For the international students in the sample, the volatility was structural rather than behavioural. Exchange rates that made the size of an incoming transfer impossible to predict, family allowances fixed in another currency, and a cost of living they had to learn from scratch.
Exchange rates fluctuate so much. I never know how much I’ll actually get after converting money, and it makes budgeting difficult.
Aziz, interview
From the interview data we built persona spectrums across eleven dimensions, including experience, frequency, time spent per session, number of tools, how finely people split their categories, overall emotion, motivation, breaks taken from budgeting, income, and financial strain. We then placed every participant on each one. Two clusters held together across enough of the spectrums to be worth naming.
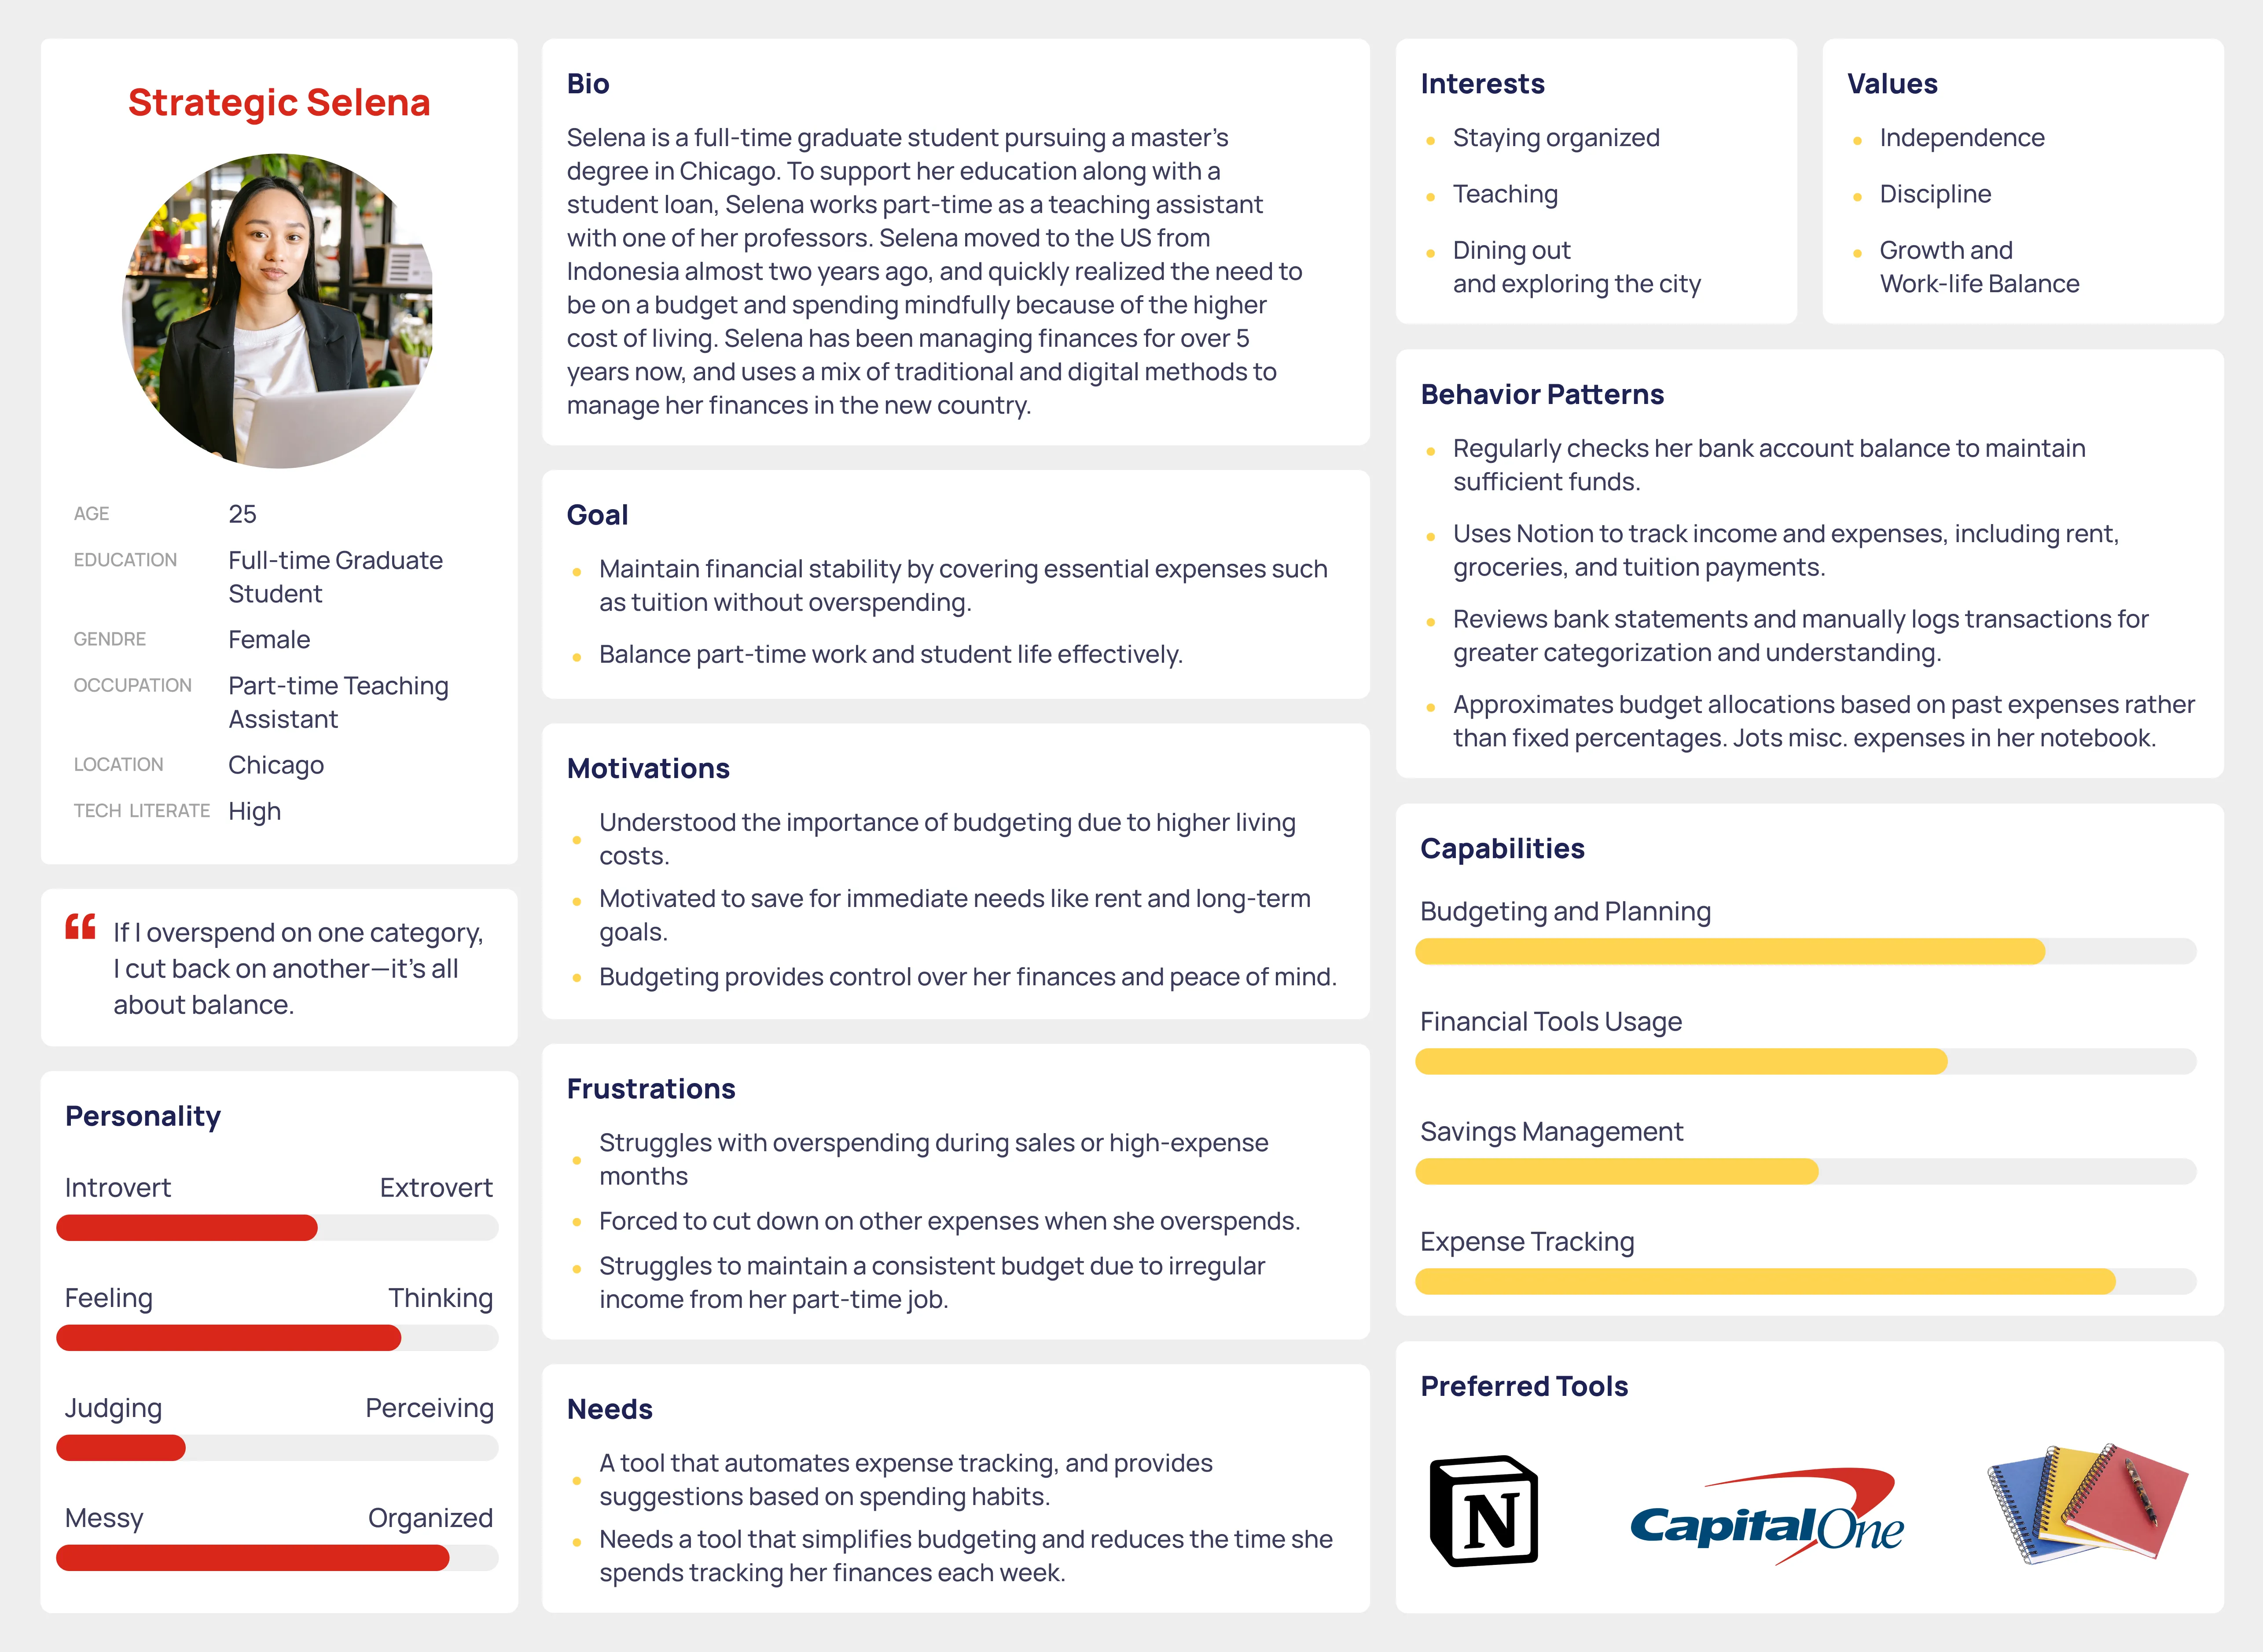
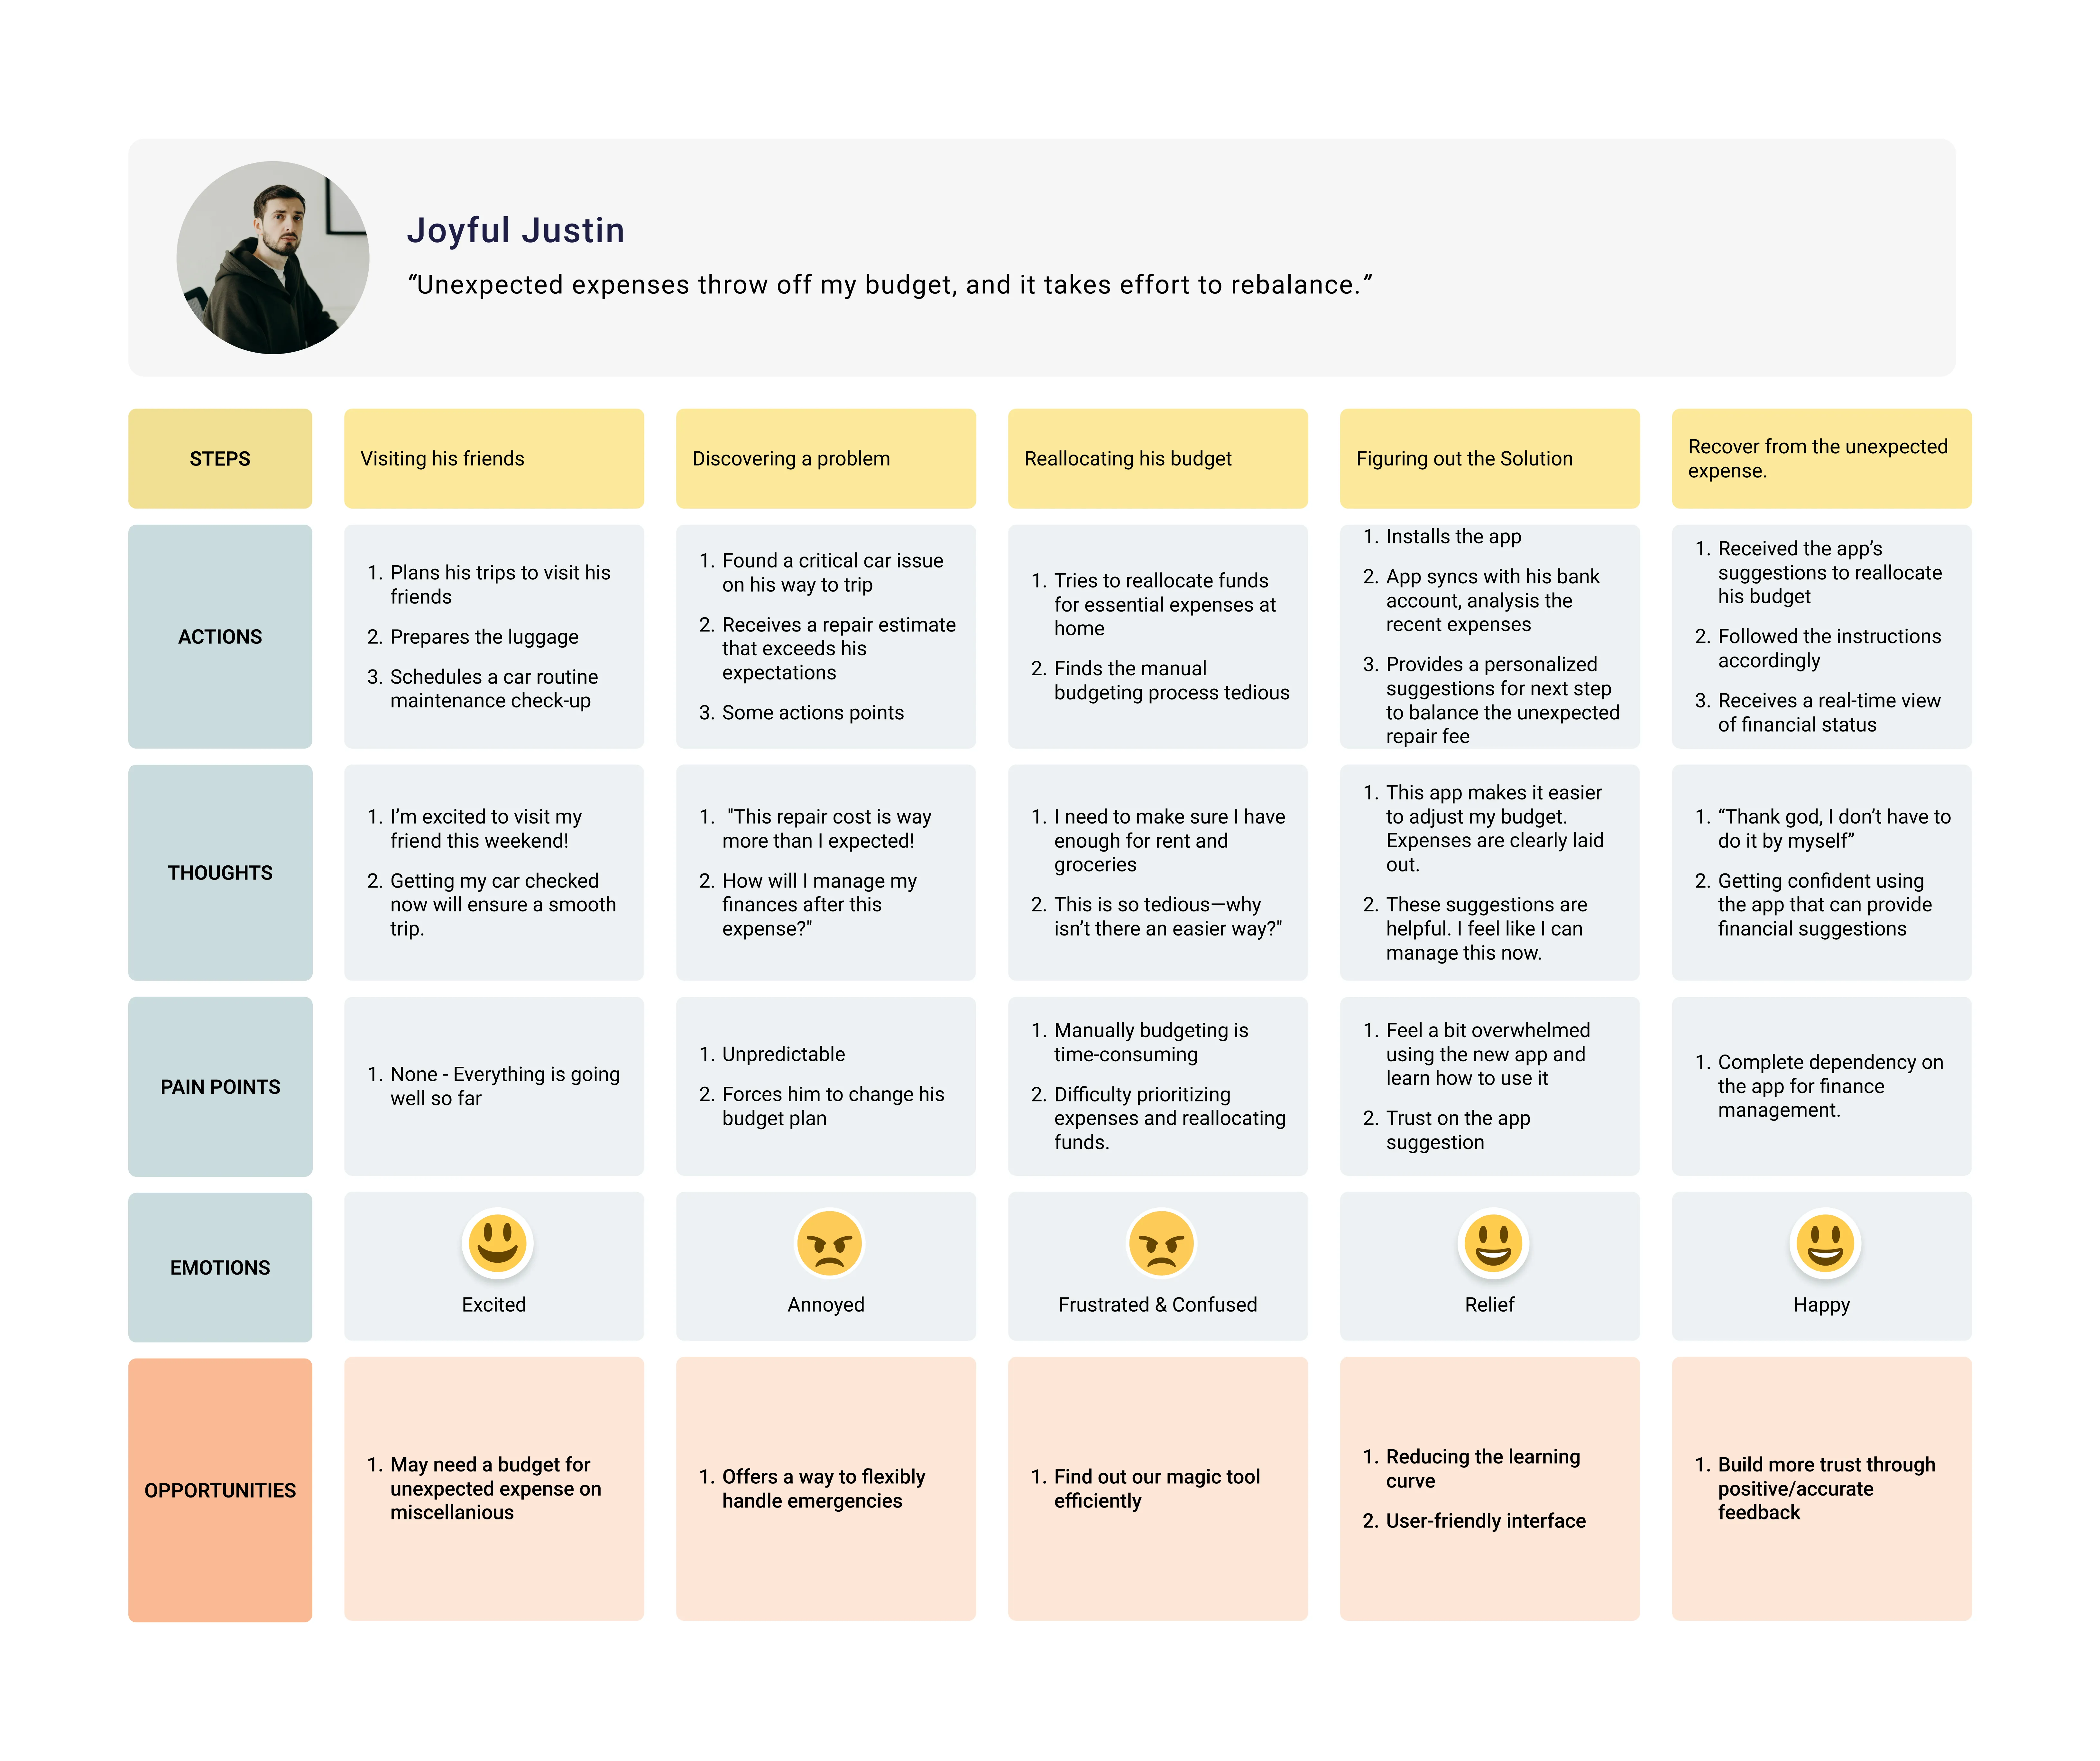
The second persona, Joyful Justin, covered the job-holder cluster, and the contrast with Selena is the reason both of them exist. Justin has what Selena is working toward. A steady paycheque, fixed costs handled, a budgeting session of about thirty minutes on payday, and long-term goals concrete enough to name a house. He is not struggling. The thing he cannot size is the buffer. His listed frustration is not knowing how much an emergency fund should hold, and his summary line is that an unexpected expense throws the budget off and takes effort to rebalance.
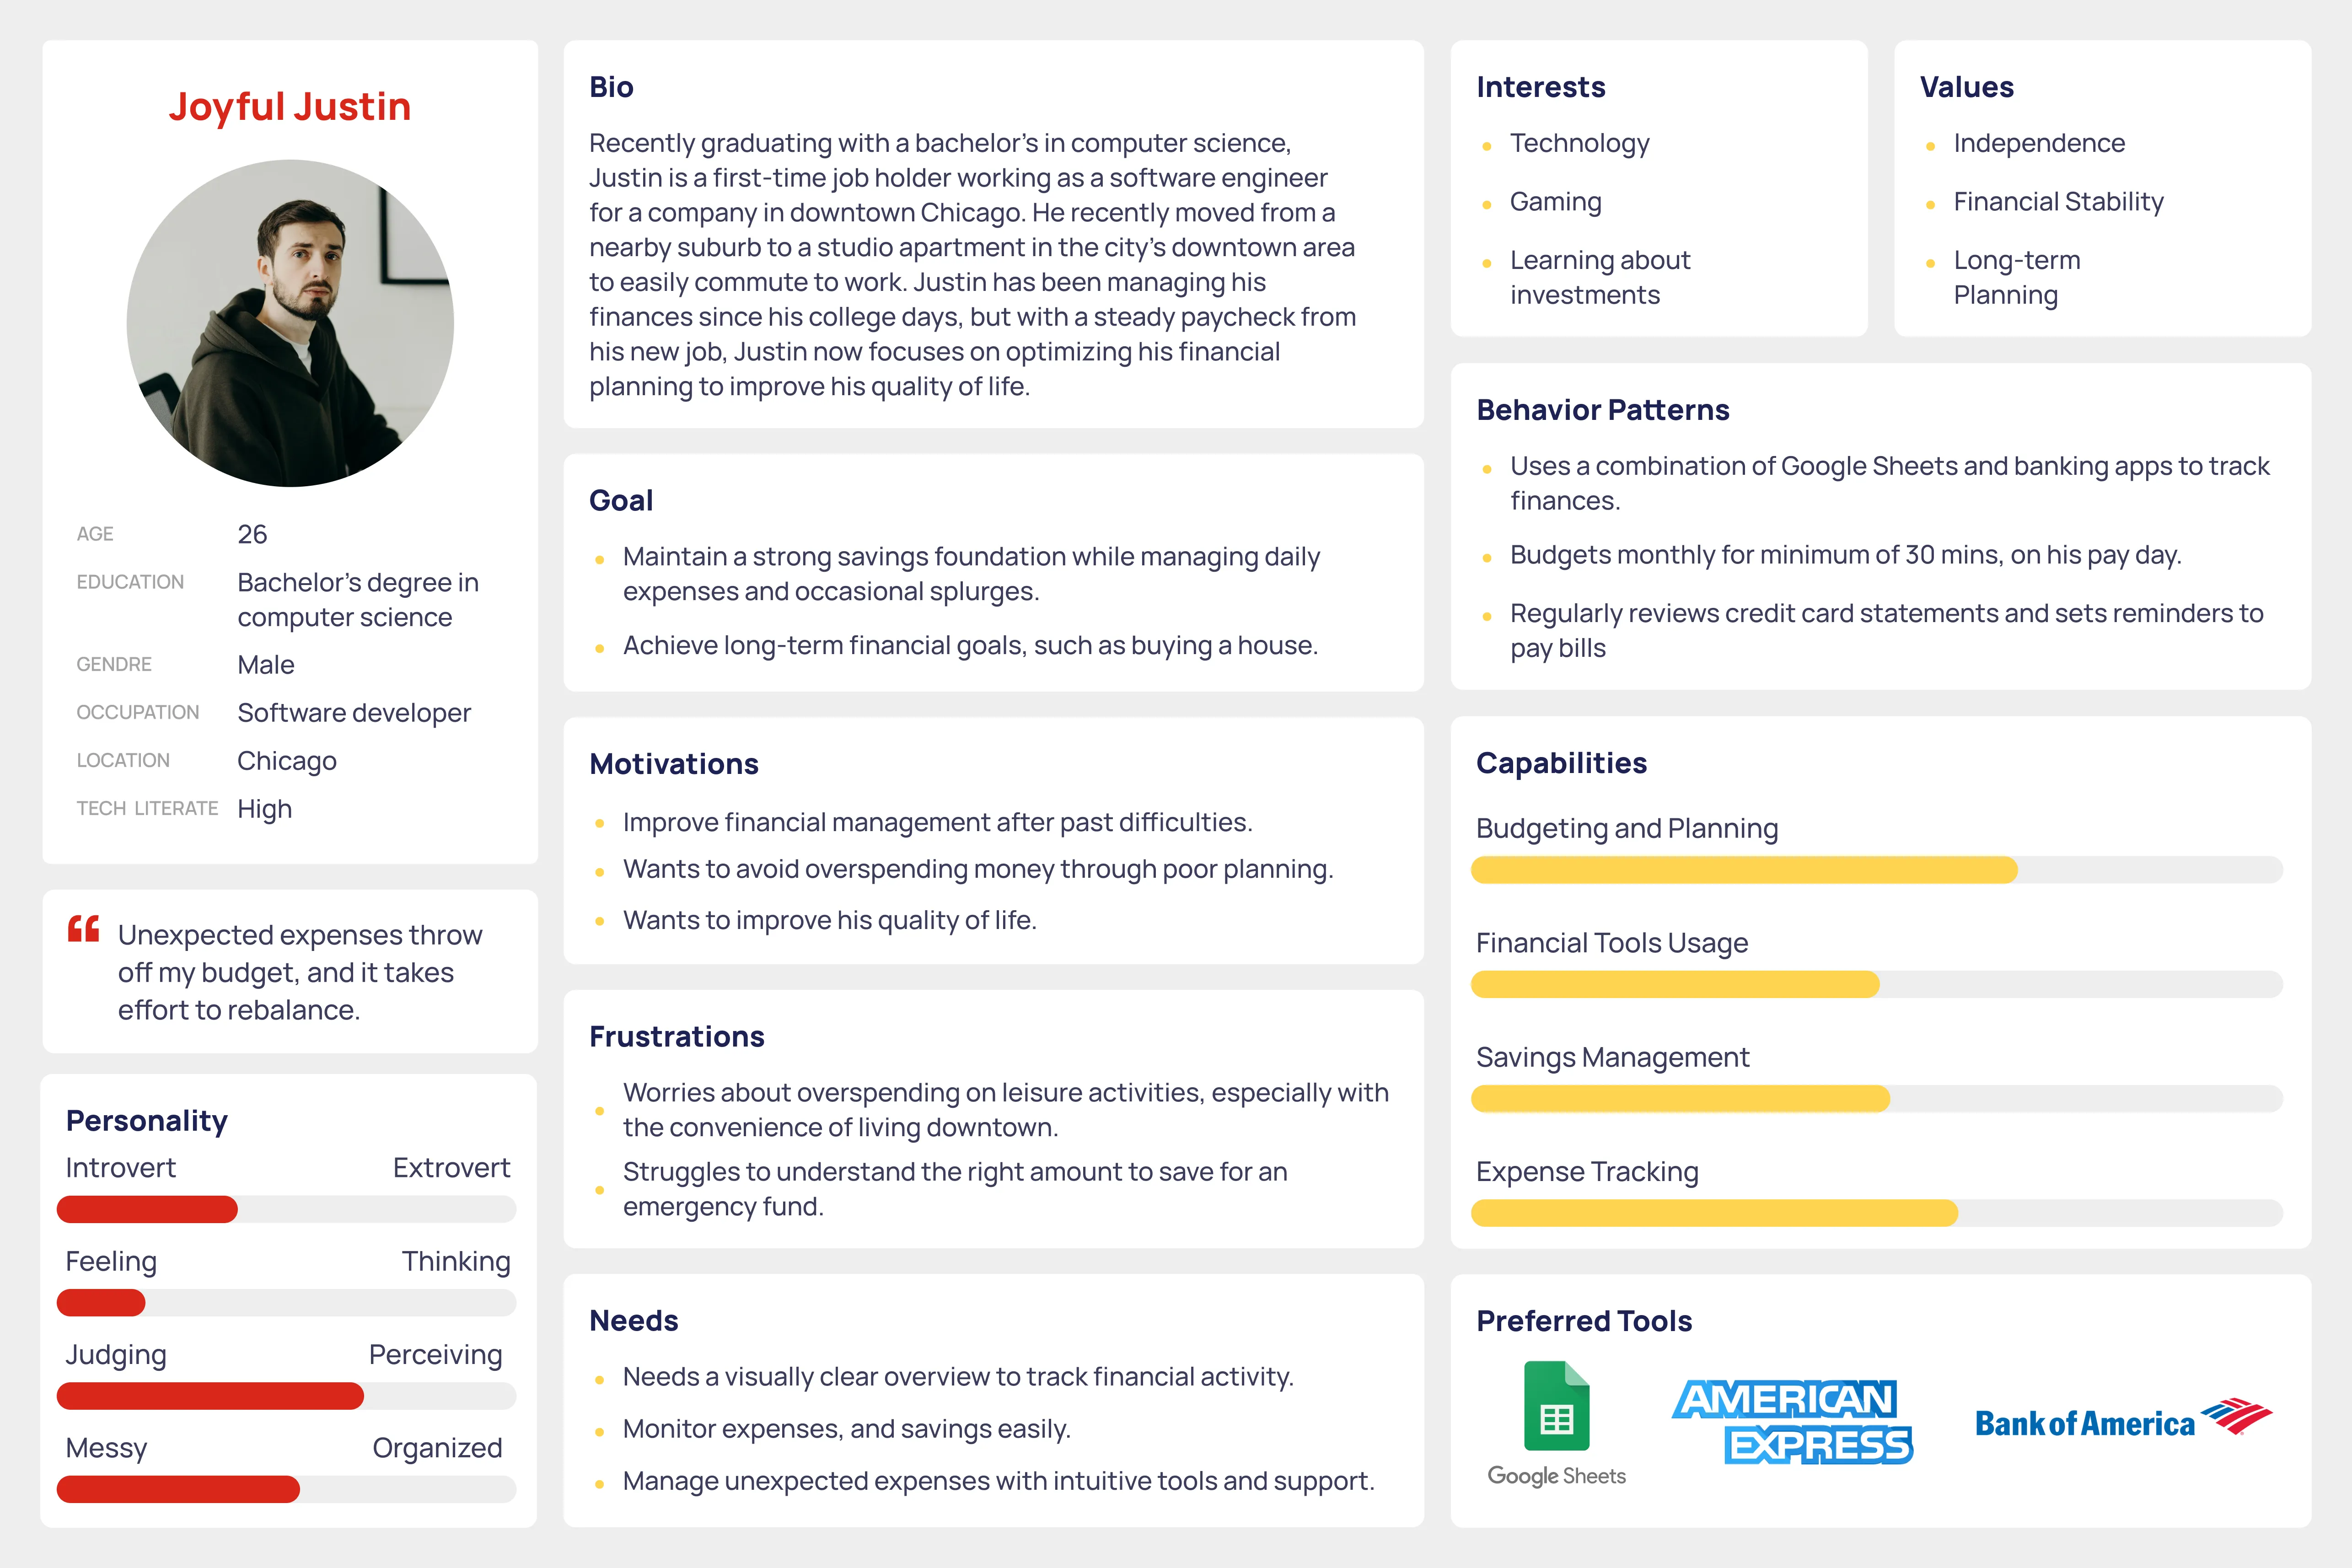
That is Selena’s failure reached from the opposite direction. Hers comes from income that fluctuates. His comes from a plan with no slack in it. Stability removed every symptom except the one that counts, which is the strongest evidence in the study that this is a problem with how budgeting tools are built rather than with how organised a person is.
Both personas were built as behavioural anchors rather than portraits. Their job was to keep us honest about which participant group a given finding came from, which matters here because the two groups were not equally represented.
04 Synthesis
Five patterns, and what each method could and could not see
Budgets do not fail from neglect. They fail at disruption. Every participant handled the predictable month competently. Fixed costs, routine review, categories that made sense to them. The failure came at the moment something arrived that the plan had not allowed for. That points somewhere specific: budgeting tools are built for the steady state, and the steady state is not when anyone needs them. The people who coped were not more disciplined than the rest. They had set aside a buffer in advance, which is a difference in structure rather than in character.
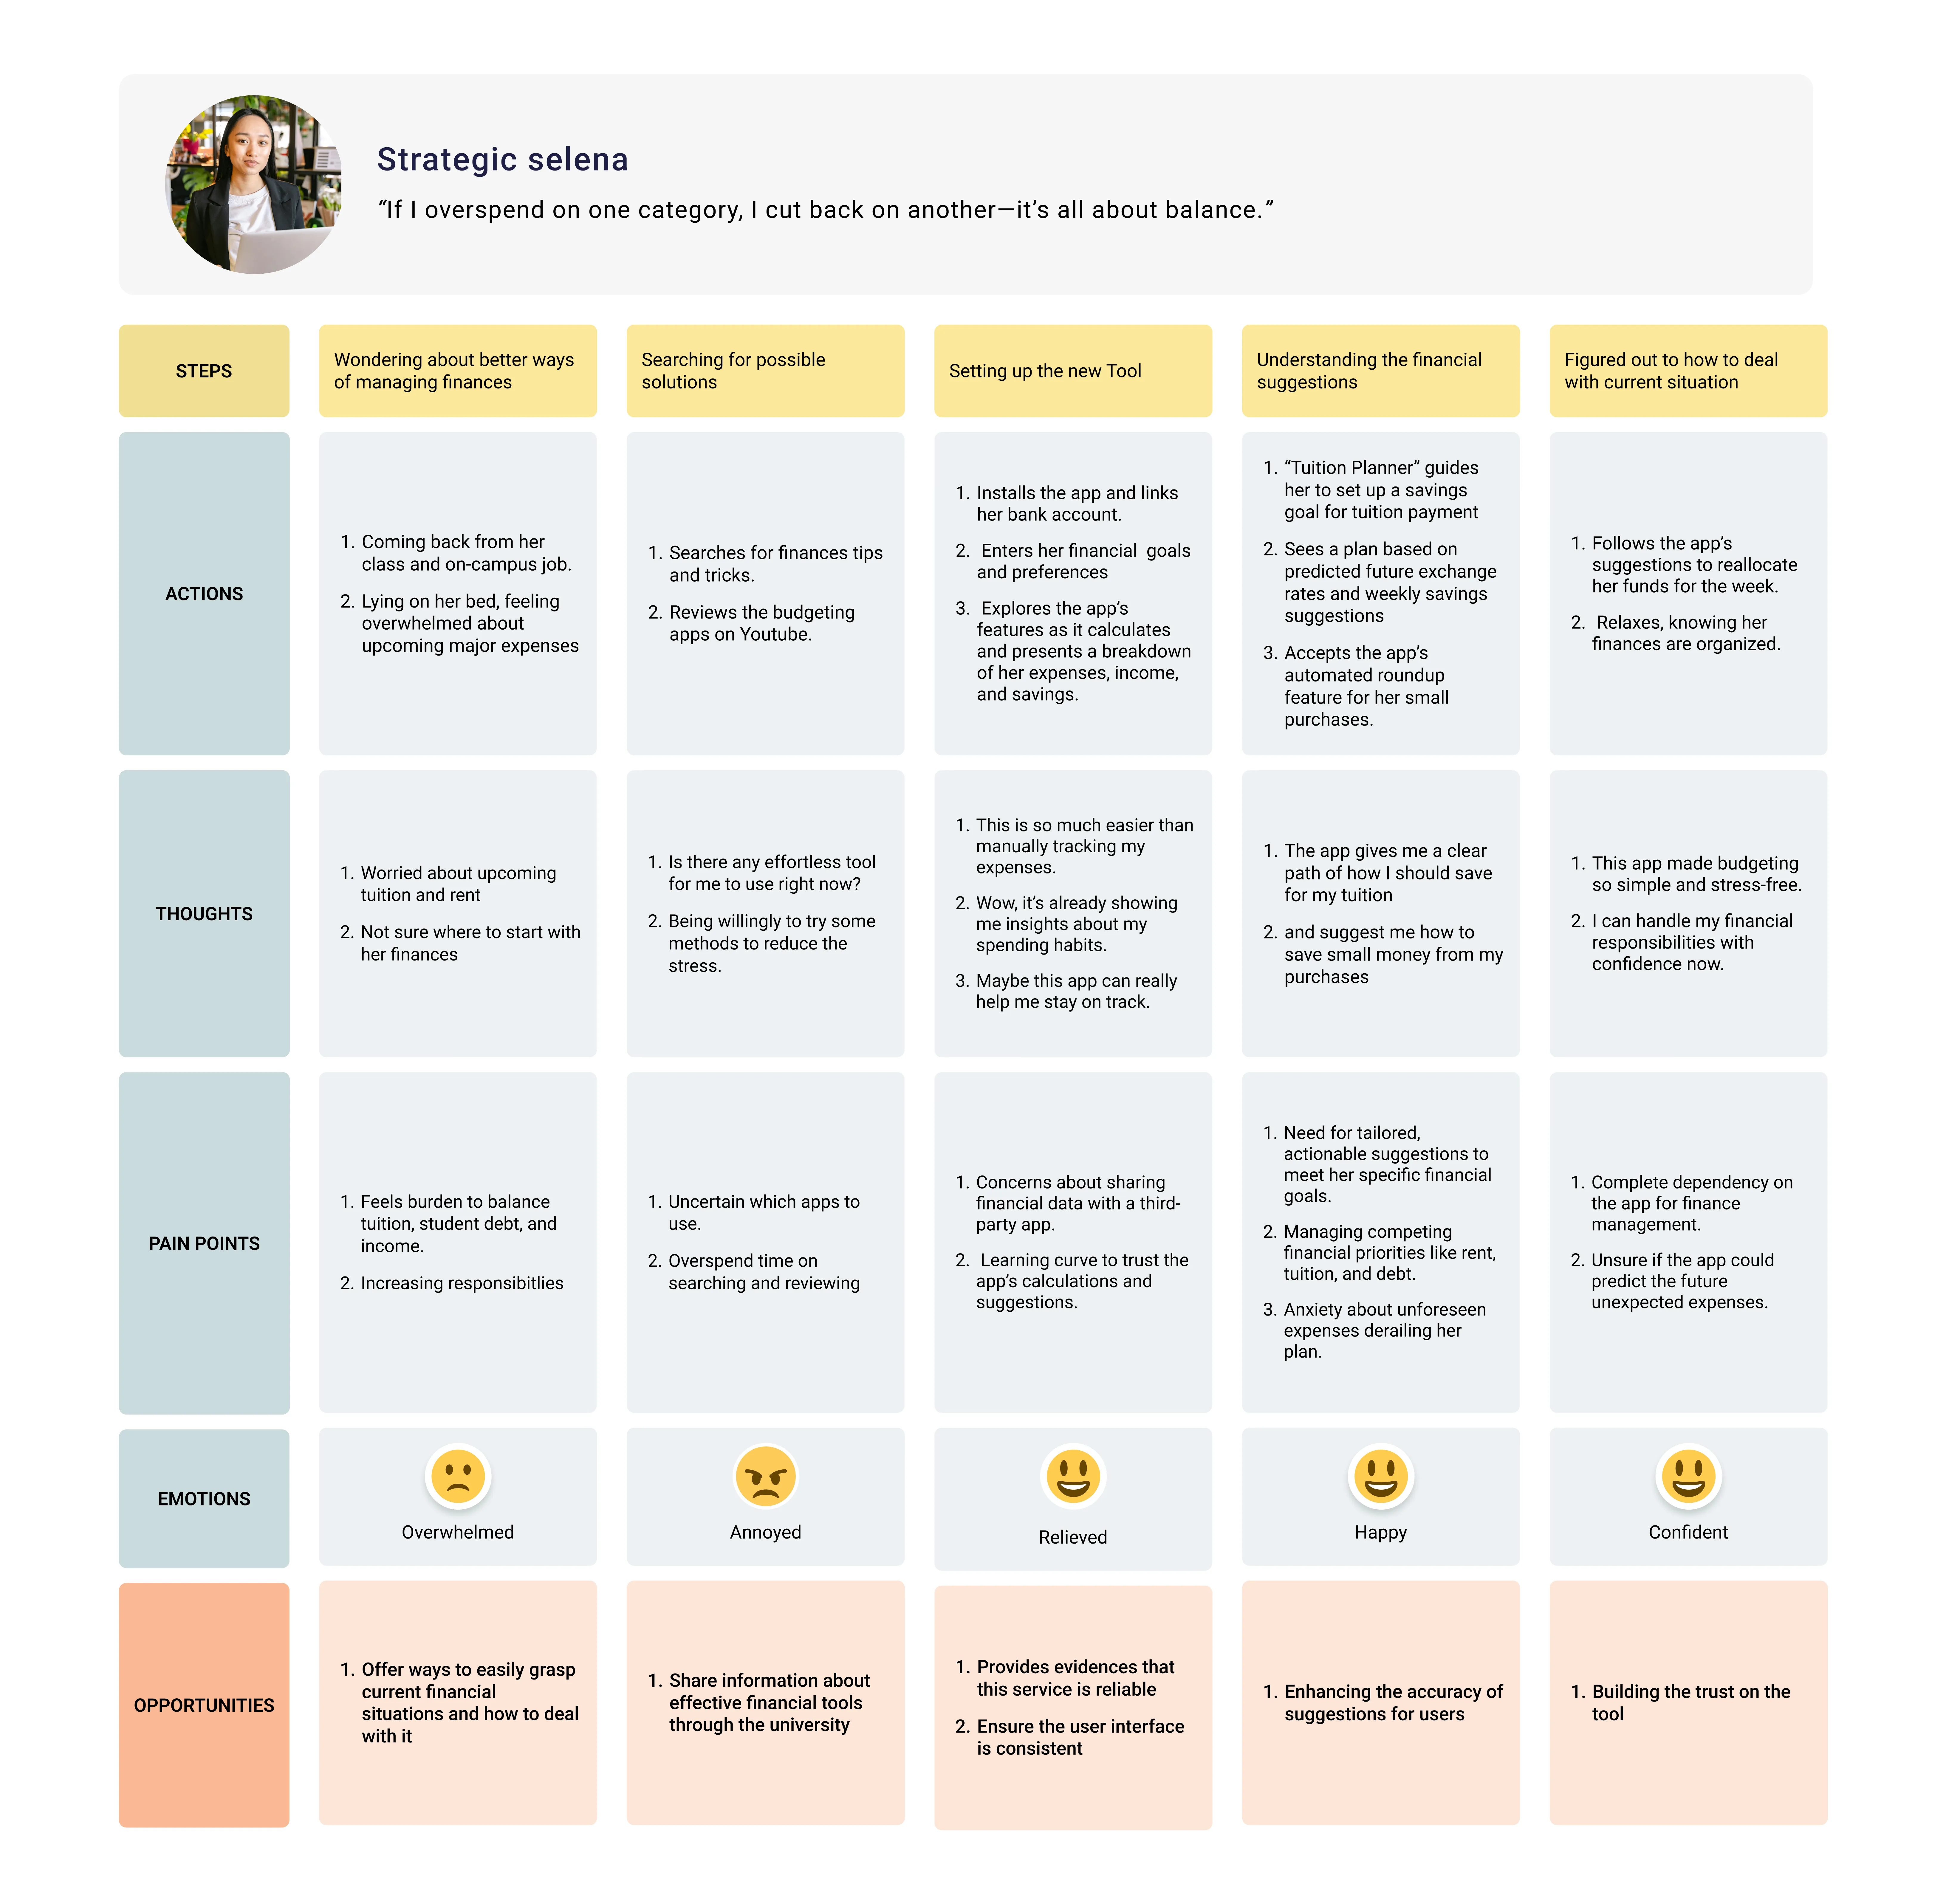
The two journey maps make the same point from different starting positions. Justin’s opens with no pain points at all. Everything is going well, the trip is planned, the car is booked in. He acquires all of them the moment a repair estimate comes back higher than he expected. Selena’s opens already overwhelmed. One column later they land on the same problem: reallocating by hand, under time pressure, with no way to tell whether the essentials are still covered.
Visibility is emotional before it is informational. Participants who could see their whole position in one place described calm and control. Participants tracking across a bank app, a spreadsheet, and a notebook described anxiety, and then avoidance. Avoidance is how tracking dies. Fragmentation is the mechanism by which people stop looking, which makes it a bigger problem than the wasted minutes suggest.
Motivation attaches to a named goal, not to saving. Nobody was moved by a generic savings category. Cassie was saving for a trip after graduation. Son was saving for tuition. The goal supplied the reason to start, and visible progress against it supplied the reason to keep going. A savings feature with nothing attached to it is asking people to be motivated by an abstraction.
Manual control buys accuracy and spends endurance. Participants working from spreadsheets, notebooks, and calculators understood their own finances better than anyone else in the sample and kept it up for the shortest time. Selena’s persona carries both of those facts together: high capability, and transactions re-entered by hand from her statements. Automation here is not about saving minutes. It is about whether the system is still running in month four.
An emergency buffer is a psychological instrument that happens to hold money. David’s $250 is small against his income and did not change much about what he could absorb. What it changed is that an unexpected expense stopped being an event that required rebuilding the plan.
The two methods disagreed in one place, and that disagreement is the most useful thing this study taught me about method. In the interviews, participants described systems that were mostly working. In the observations, watching them allocate for Kevin and then handle a surprise expense mid-task, the seams showed. Hesitation, recalculation, categories raided in an order they had clearly used before and had not thought to mention. Neither account is wrong. The interview reports the system people believe they run. The observation shows the workarounds keeping it running, which stay invisible because they have become routine. Running only one of the two would have given us a confident and incomplete study.
One honest caveat about our own synthesis. The scenarios and journey maps we wrote imagine an app that magically understands a person’s finances from a single tap, and a scenario that assumes the hard part away is always going to resolve into a happy ending. What kept those artifacts useful was the pain-point row, which we wrote from participant data rather than from the story: third-party data sharing, the trust cost of a learning curve, dependency on the tool. Those survived the optimism, and they are the parts worth designing against.
05 Recommendation
Ten features scored, and what actually follows from the evidence
The team scored ten candidate features against user impact and technical feasibility. Priority was the judgement we made from those two axes, and the rows where priority disagrees with them are the ones worth reading closely.
| No. | Feature | Impact | Feasibility | Priority |
|---|---|---|---|---|
| 01 | Automatic expense tracking and breakdown | High | Low | Medium |
| 02 | Real-time budget reallocation suggestions | High | Medium | High |
| 03 | Goal-based savings setup | Medium | Medium | High |
| 04 | Personalised savings plan | Medium | High | Medium |
| 05 | Automatic small savings | Medium | High | Medium |
| 06 | Bank account integration | High | High | High |
| 07 | Actionable suggestions | High | Medium | High |
| 08 | Budget adjustment assistance | Medium | Medium | Medium |
| 09 | Clear financial visualization | High | High | High |
| 10 | Encouragement through feedback | Low | High | Low |
10 features scored → 2 high on both axes
Bank account integration and clear financial visualization: the only rows where the evidence and the build cost agreed
Two rows repay a closer look. Row 01 scored high on impact and low on feasibility and we ranked it medium. Automatic tracking is what participants wanted most and it is the hardest thing on the list to build well, so putting it at the top would have been wishful. Row 10 went the other way. Encouragement through feedback is cheap to ship, and nothing across seventeen sessions suggested anyone wanted it. Being easy to build is not a reason to build something.
| Principle | Rule |
|---|---|
| Design for the month that goes wrong | Rebalancing is the main flow, not an edge case. When an unexpected expense lands, propose the reallocation instead of leaving someone to raid a category by hand. |
| Put the whole position on one screen | Spending, remaining budget, and savings progress in one view. Fragmentation across tools is what produces avoidance, and avoidance is how tracking ends. |
| Attach savings to a named goal | Tuition, an emergency, a trip. A generic savings category carries no motivation. A target with visible progress against it does. |
| Automate the entry, keep the categories | Bank integration with categorisation the user can edit. Manual entry buys accuracy and spends endurance, so remove the transcription and leave the control alone. |
| Make the buffer part of the plan | Prompt a small, regular emergency allocation and keep it visibly separate. Its value is that it stops a surprise from requiring a rebuild. |
| Say what to do, not what happened | An over-budget alert states a fact the person already knows. The useful version names the adjustment, which is what participants asked for and what a passive notification cannot give them. |
Four limits, stated plainly. Seventeen participants is enough to find behaviour and not enough to estimate how common it is, so nothing above should be read as a rate. The sample skewed to students, which means the first-time job holders we set out to understand are exactly the group we under-recruited. That makes Joyful Justin the thinner of the two personas and the findings about steady-income budgeting the weaker half of the study. The observation ran on a hypothetical scenario rather than on anyone’s real accounts, so what we watched is a reconstruction of behaviour, and some participants plainly drifted into describing their own situation instead of Kevin’s. And the study stops at implications. Nothing here was designed, built, or tested with anyone.
The next step follows from the second of those. Recruit the job-holder group deliberately instead of by snowball, run a diary study long enough to catch a real disruption rather than a simulated one, and check the tracking findings against actual transaction data instead of against what people remember spending. Then build the reallocation flow, which is the highest-impact row on the matrix that nobody currently ships, and test whether a proposed rebalance keeps people in the system through the month that goes wrong.
The full study, including both protocols, the participant tables, the coding, the persona spectrums, and the complete priority matrix, is in the research report (opens in a new tab).